

Current Market.
April home sales increase following early-year mortgage rate dip
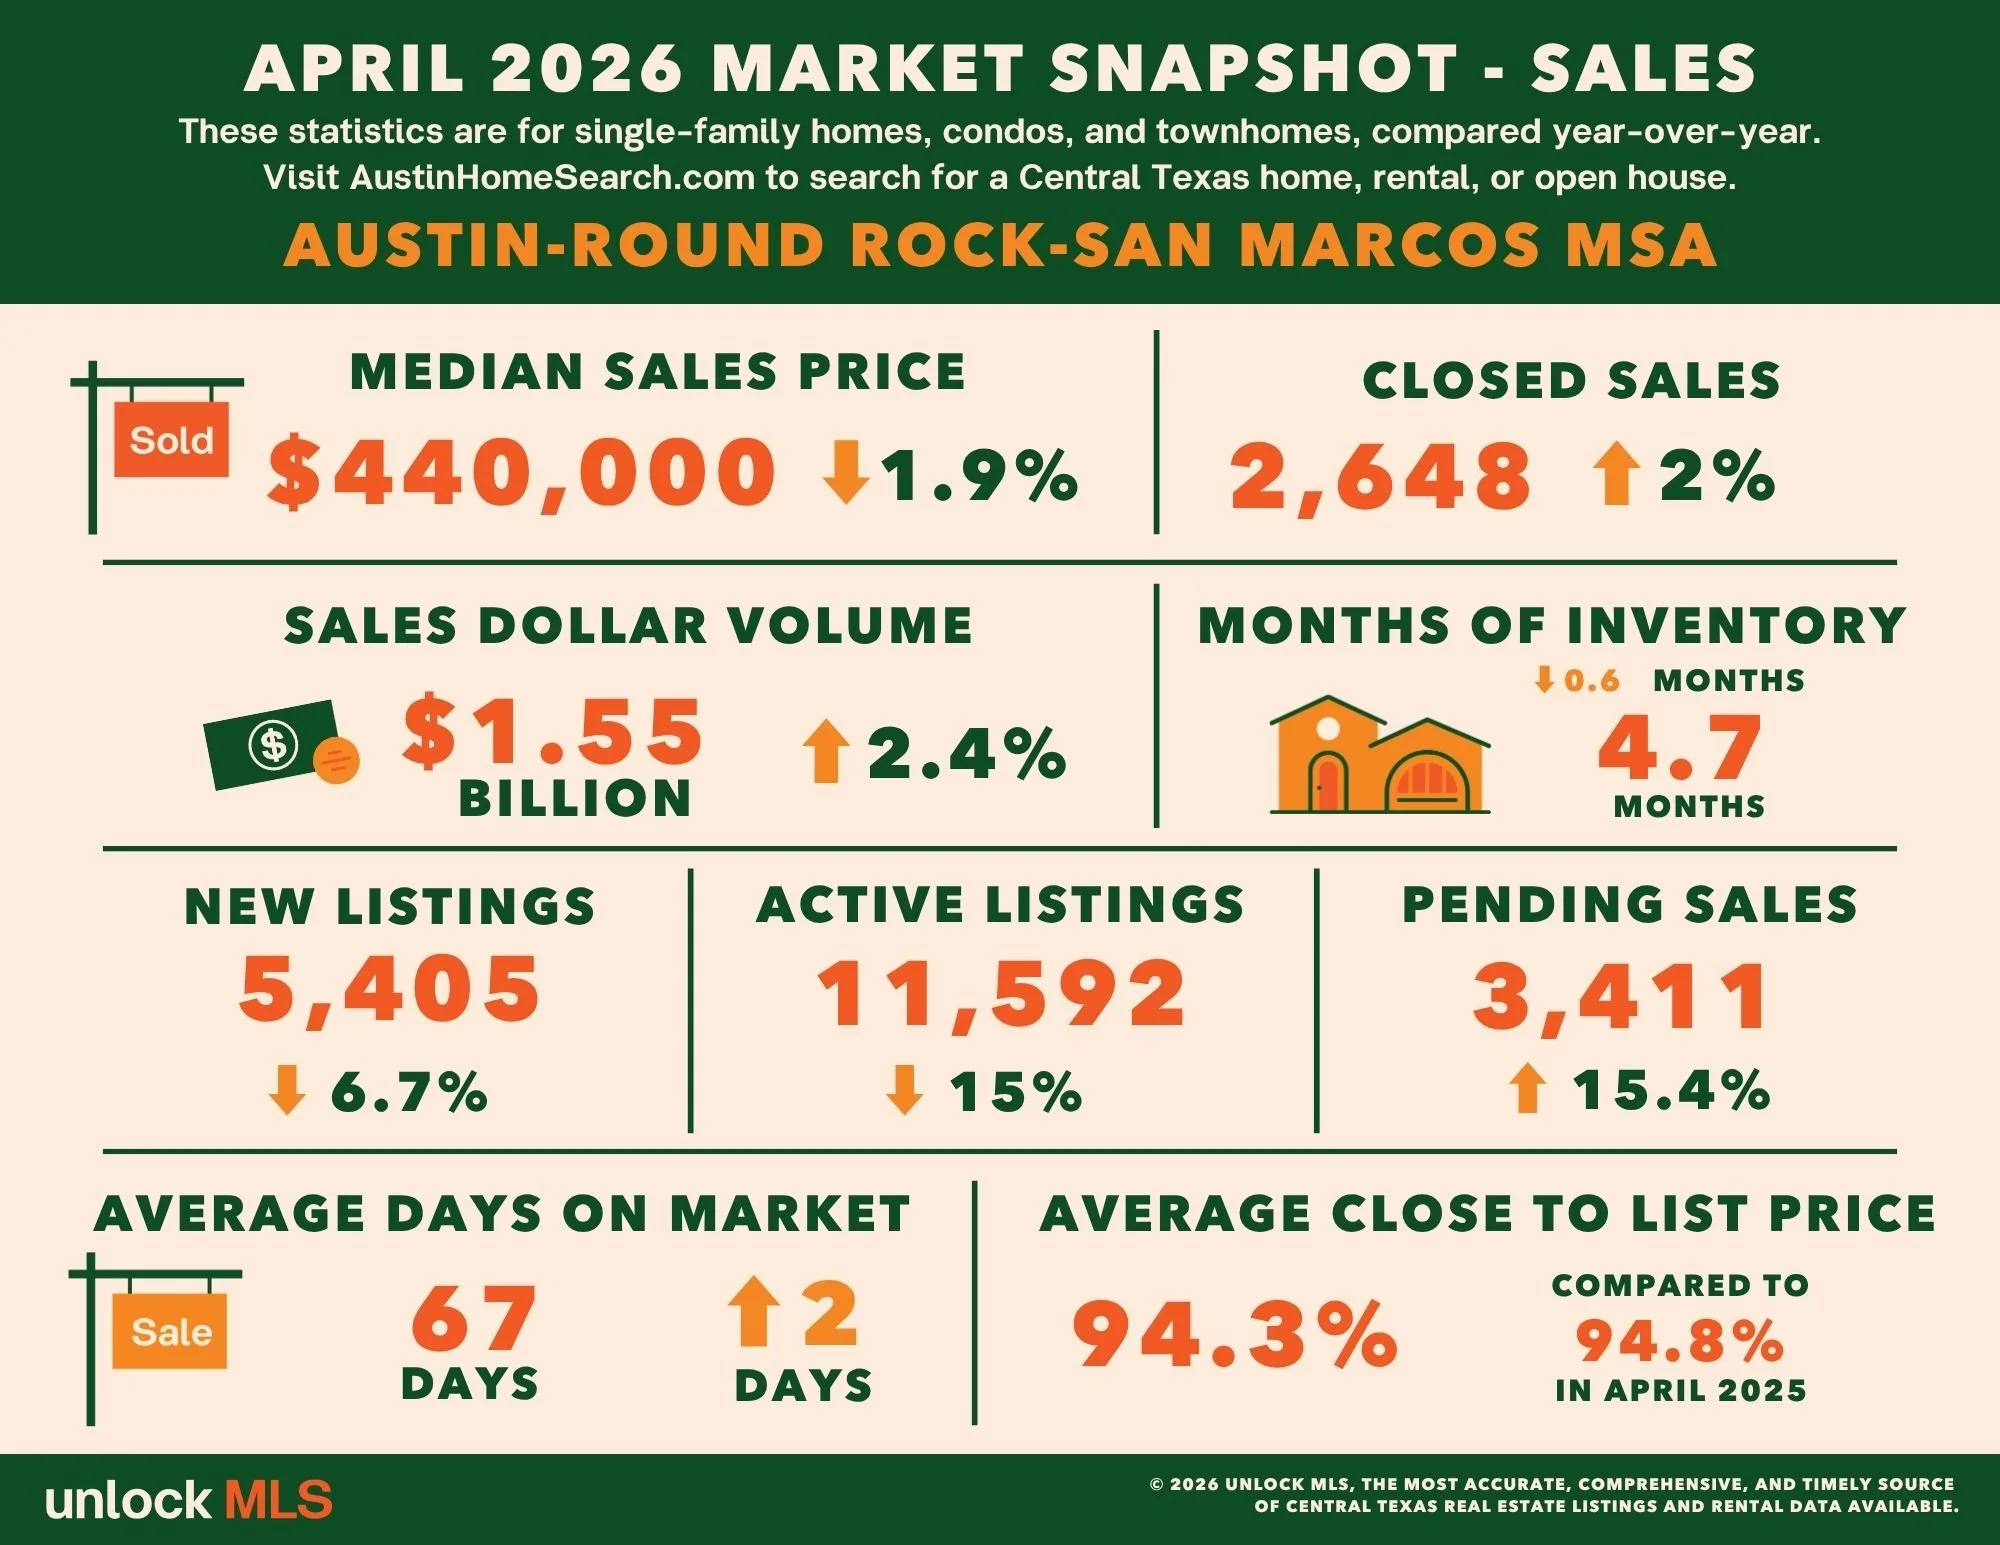
AUSTIN, Texas — According to the April 2026 Central Texas Housing Report released by Unlock MLS, the Austin-Round Rock-San Marcos MSA showed a notable shift in buyer confidence this spring as consumers actively re-entered the market during a brief window of lower mortgage rates earlier this year. Pending sales increased 15.4% year over year to 3,411 transactions in April, while closed sales rose 2.0% year over year to 2,648 sales, signaling continued momentum in the Austin-area housing market. As the region heads into peak selling season, the market continues to show strength despite broader global economic uncertainty, reflecting steady demand and renewed consumer confidence.
Vaike O’Grady, market research advisor at Unlock MLS, said April’s housing activity suggests buyers responded quickly when borrowing conditions became more favorable earlier this spring.
“What stands out in April’s data is the shift in buyer psychology and overall market momentum. Many buyers who had been delaying their home search took advantage of the temporary dip in mortgage rates we saw earlier this year and moved quickly once conditions became more manageable. That activity is now showing up in both pending and closed sales data. Buyers are stepping back into the market with more urgency, especially when homes are priced correctly, and pending sales continue to be one of the clearest indicators of where the market is heading. April’s numbers show that confidence is building despite higher borrowing costs and ongoing economic uncertainty.”
John Crowe, 2026 Unlock MLS and ABoR president, noted that the spring market is proving that demand in Central Texas remains strong despite ongoing affordability challenges.
“In April, the rise in sales—both year-over-year and month-over-month—indicates that buyers are purchasing homes because it is a good investment. At the same time, affordability remains one of the biggest challenges facing Central Texas families. That’s why expanding housing supply at a variety of accessible price points remains so important. Reports like Unlock MLS’ and ABoR’s recent HOME Impact Report show that increasing housing options can help create more attainable pathways to homeownership across our region.”
Austin-Round Rock-San Marcos MSA
April 2026 - For Sale
2,648 – Residential homes sold, 2.0% more than April 2025.
$440,000 – Median price for residential homes, 1.9% less than April 2025.
5,405 – New home listings on the market, 6.7% less than April 2025.
11,592 – Active home listings on the market, 15.0% less than April 2025.
3,411 – Pending sales, 15.4% more than April 2025.
4.7 – Months of inventory, 0.6 less than April 2025.
$1,554,376,535 – Total dollar volume of homes sold, 2.4% more than April 2025.
94.3% – Average close to list price, compared to 94.8% in April 2025.
April 2026 - For Lease
2,631 – Closed leases, 0.2% more than April 2025.
$2,100 – Median price for rent, 4.5% less than April 2025.
3,623 – New lease listings on the market, 1.1% less than April 2025.
3,810 – Active lease listings on the market, 7.3% less than April 2025.
3,185 – Pending sales, 12.9% more than April 2025.
1.8 – Months of inventory, flat compared to April 2025.
$6,214,492 – Total dollar volume of leases, 4.5% less than April 2025.
97.7% – Average close to list price, compared to 97.6% in April 2025.
-
April 2026 - For Sale
980 – Residential homes sold, 8.5% more than April 2025.
$573,750 – Median price for residential homes, 3.2% less than April 2025.
2,032 – New home listings on the market, 11.7% less than April 2025.
3,987 – Active home listings on the market, 24.3% less than April 2025.
1,219 – Pending sales, 20.0% more than April 2025.
4.5 – Months of inventory, 1.4 less than April 2025.
$748,006,685 – Total dollar volume of homes sold, 6.1% more than April 2025.
94.9% – Average close to list price, compared to 95.1% in April 2025.
April 2026 - For Lease
1,349 – Closed leases, 1.6% more than April 2025.
$2,150 – Median price for rent, 6.5% less than April 2025.
1,862 – New lease listings on the market, 1.6 less than April 2025.
1,975– Active lease listings on the market, 6.4% less than April 2025.
1,631 – Pending sales, 13.0% more than April 2025.
2.0 – Months of inventory, flat compared to April 2025.
$3,421,351 – Total dollar volume of leases, 4.3% less than April 2025.
97.5% – Average close to list price, compared to 97.4% in April 2025.
-
April 2026 - For Sale
1,249 – Residential homes sold, 4.7% more than April 2025.
$505,000 – Median price for residential homes, 1.9% less than April 2025.
2,644 – New home listings on the market, 10.3% less than April 2025.
5,615 – Active home listings on the market, 19.0% less than April 2025.
1,566 – Pending sales, 20.4% more than April 2025.
4.8 – Months of inventory, 1.0 months less than April 2025.
$881,801,119 – Total dollar volume of homes sold, 4.8% more than April 2025.
94.6% – Average close to list price, compared to 95.0% in April 2025.
April 2026 - For Lease
1,540 – Closed leases, 1.5% more than April 2025.
$2,159 – Median price for rent, 6.1% less than April 2025.
2,131 – New lease listings on the market, 0.7% less than April 2025.
2,369 – Active lease listings on the market, 5.3% less than April 2025.
1,850 – Pending sales, 14.7% more than April 2025.
2.1 – Months of inventory, 0.1 months more than April 2025.
$3,901,556 – Total dollar volume of leases, 4.0% less than April 2025.
97.5% – Average close to list price, compared to 97.4% in April 2025.
-
April 2026 - For Sale
878 – Residential homes sold, 1.3% less than April 2025.
$412,490 – Median price for residential homes, 4.1% less than April 2025.
1,728 – New home listings on the market, 0.9% less than April 2025.
3,460 – Active home listings on the market, 12.8% less than April 2025.
1,183 – Pending sales, 18.7% more than April 2025.
4.1 – Months of inventory, 0.4 months less than April 2025.
$423,180,384 – Total dollar volume of homes sold, 2.5% less than April 2025.
94.7% – Average close to list price, compared to 95.0% in April 2025.
April 2026 - For Lease
811 – Closed leases, 2.1% less than April 2025.
$2,095 – Median price for rent, 2.6% less than April 2025.
1,101 – New lease listings on the market, 1.4% less than April 2025.
941 – Active lease listings on the market, 19.4% less than April 2025.
962 – Pending sales, 7.2% more than April 2025.
1.3 – Months of inventory, 0.2 months less than April 2025.
$1,737,776 – Total dollar volume of leases, 5.9% less than April 2025.
98.0% – Average close to list price, compared to 97.8% in April 2025.
-
April 2026 - For Sale
350 – Residential homes sold, 3.0% less than April 2025.
$419,990 – Median price for residential homes, 8.8% more than April 2025.
699 – New home listings on the market, 10.0% less than April 2025.
1,601 – Active home listings on the market, 14.4% less than April 2025.
437 – Pending sales, 14.3% less than April 2025.
4.7 – Months of inventory, 0.6 months less than April 2025.
$183,236,211 – Total dollar volume of homes sold, 0.8% less than April 2025.
94.1% – Average close to list price, flat compared to April 2025.
April 2026 - For Lease
217 – Closed leases, flat compared to April 2025.
$1,971 – Median price for rent, 2.4% less than April 2025.
300 – New lease listings on the market, 2.3% less than April 2025.
351 – Active lease listings on the market, 3.8% more than April 2025.
281 – Pending sales, 16.6% more than April 2025.
2.0 – Months of inventory, 0.5 months more than April 2025.
$455,114 – Total dollar volume of leases, 3.6% less than April 2025.
97.5% – Average close to list price, compared to 98.3% in April 2025.
-
April 2026 - For Sale
123 – Residential homes sold, 9.8% more than April 2025.
$350,000 – Median price for residential homes, 2.9% more than April 2025.
227 – New home listings on the market, 7.3% less than April 2025.
712 – Active home listings on the market, 2.0% more than April 2025.
163 – Pending sales, 45.5% more than April 2025.
7.3 – Months of inventory, 0.1 months more than April 2025.
$50,227,818 – Total dollar volume of homes sold, 9.5% more than April 2025.
91.1% – Average close to list price, compared to 93.0% in April 2025.
April 2026 - For Lease
41 – Closed leases, 14.6% less than April 2025.
$1,950 – Median price for rent, 0.3% less than April 2025.
66 – New lease listings on the market, 9.6% less than April 2025.
108 – Active lease listings on the market, 42.1% more than April 2025.
63 – Pending sales, 21.2% more than April 2025.
3.5 – Months of inventory, 1.4 months more than April 2025.
$83,079 – Total dollar volume of leases, 11.4% less than April 2025.
98.3% – Average close to list price, compared to 96.8% in April 2025.
-
April 2026 - For Sale
48 – Residential homes sold, 23.1% more than April 2025.
$262,994 – Median price for residential homes, 12.3% less than April 2025.
107 – New home listings on the market, 28.9% more than April 2025.
204 – Active home listings on the market, 12.1% more than April 2025.
62 – Pending sales, 72.2% more than April 2025.
6.0 – Months of inventory, 0.5 months more than April 2025.
$15,931,003– Total dollar volume of homes sold, 30.3% more than April 2025.
90.2% – Average close to list price, compared to 95.1% in April 2025.
April 2026 - For Lease
22 – Closed leases, 37.5% more than April 2025.
$1,695 – Median price for rent, 5.2% less than April 2025.
25 – New lease listings on the market, 13.6% more than April 2025.
41 – Active lease listings on the market, 46.4% more than April 2025.
29 – Pending sales, 61.1% more than April 2025.
2.1 – Months of inventory, 0.4 months more than April 2025.
$36,967 – Total dollar volume of leases, 38.9% more than April 2025.
95% – Average close to list price, compared to 96.8% in April 2025.